The Site Activity Report displays usage graphs for CatapultEMS and a table that takes you to each individual report as needed. The Site Activity Report answers questions like:
- Have all sites completed their required fire drills?
- Which sites use CatapultEMS the most (or least)?
- How many medical emergencies were reported across the organization/district?
Details are available for each incident. For more information, see Activity Report Detail.
How to get there
- Sign in to CatapultEMS.com with a District Safety Team account.
- From the District Command Center, choose Site Activity Report.
- Choose a Start Date and End Date.
- Review the other choices (see Parameters below).
- Choose Search Incidents.
- Review the interactive pie charts (see Charts below).
- Review the interactive table (see Table below).
Parameters
- Sites: Leave as "All Sites" or choose the sites you want to investigate.
- Report Status: Active includes unresolved reports (like an ongoing drill). Archived includes all resolved reports.
- Incident Escalation: Leave all selected or choose from Incident Report, Caution Alert (Code Yellow), Action Alert (Code Red), and Drill.
- Incident Type: Leave all selected or choose an incident types from staff and anonymous reports. CatapultEMS groups incident types by name, so if choose Bullying and have a staff incident type and an anonymous report by the same name, it shows both.
- Districts: If you are assigned to more than one district (this is rare), select the districts you want.
- Group By: Group by Incident Type, Site, or Site and Incident Type. The last option is helpful for answering the question, "Have all sites completed their required fire drill?"
Excel
Choose Excel if you want to download the data in a spreadsheet format. The file includes two sheets.
- Report Charts: includes all graphs.
- Activity Report: includes details for every incident that matches your chosen parameters.
For large districts, the Excel report may take time to generate and download.
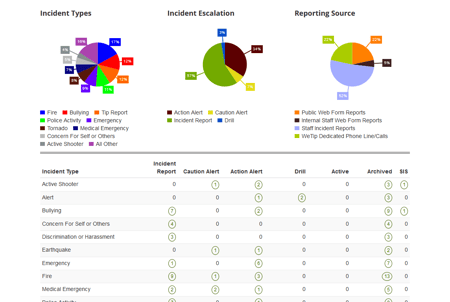
Charts
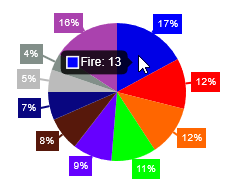
For the Incident Types chart, hover over each slice of the pie to see its label and the number of incidents. In the example below, the blue slice represents 13 fire reports.
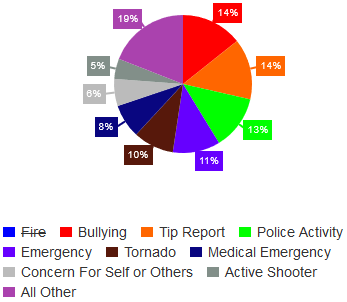
In the legend below each chart, click to remove a category from the chart. The chart updates and recalculates the percentages. In the example below, notice "Fire" is crossed out in the legend and no longer appears in the pie chart.
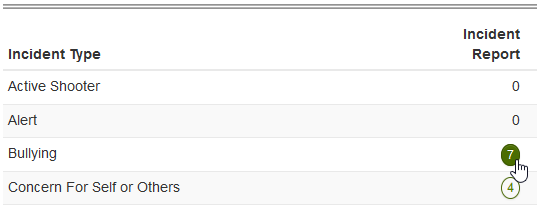
Table
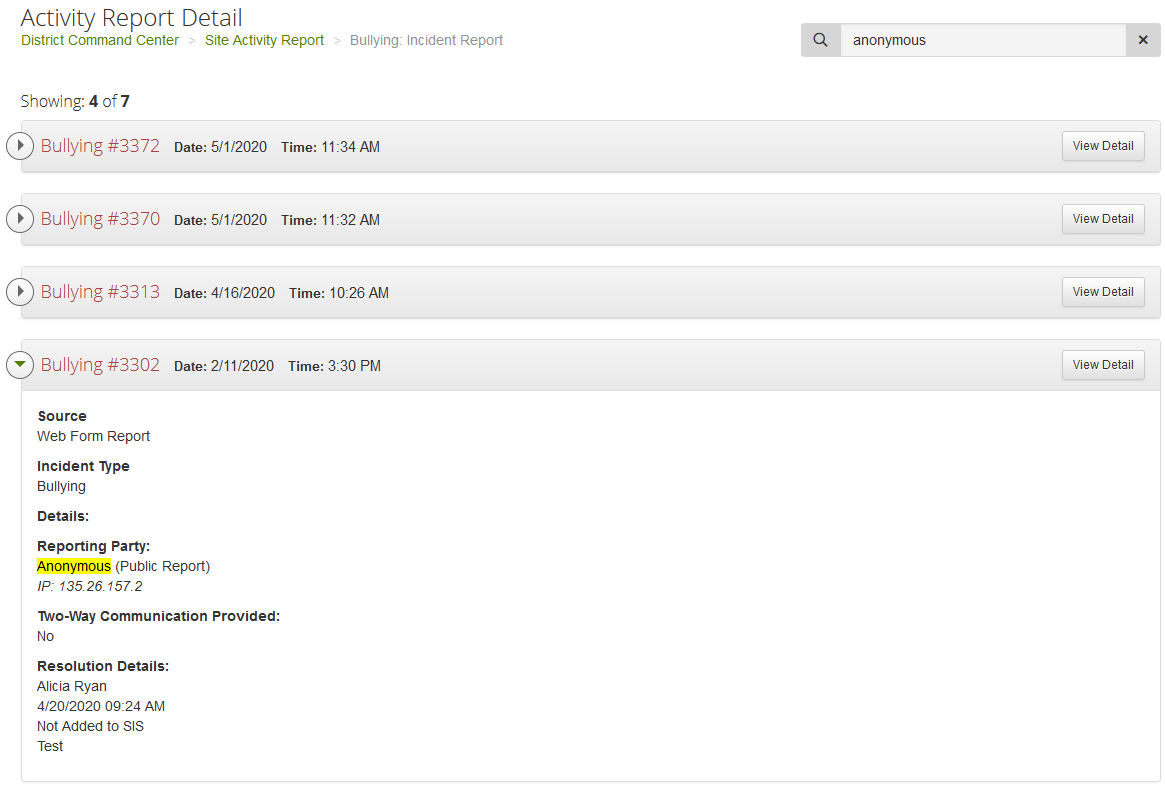
In the table choose any circled number to review individual reports.
Choose any report on the next page to see details. If you review many incidents at once, the full details might take a moment to load.
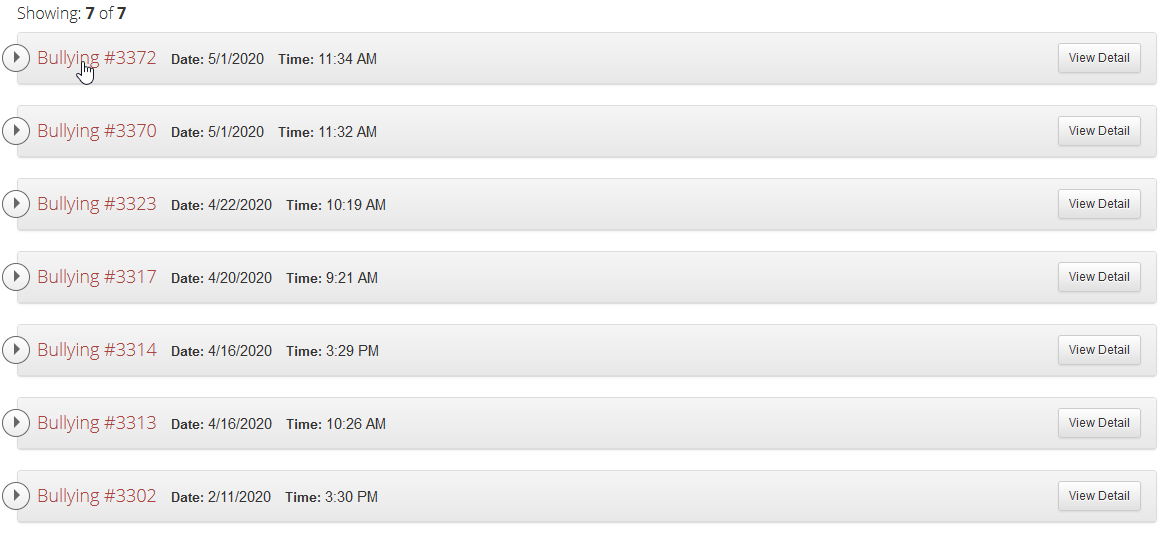
Use the search feature to narrow down the list of reports. CatapultEMS highlights the matching text in yellow.